In medical diagnostics, clinical decisions hinge entirely on the analytical precision of laboratory equipment. Whether measuring serum creatinine, glycated hemoglobin, or cardiac troponin, clinicians trust that a reported value reflects the patient's true physiological state. However, automated clinical chemistry, hematology, and immunoassay analyzers are prone to subtle analytical errors caused by reagent lot degradation, deteriorating lamp optics, microfluidic clogs, and environmental temperature fluctuations.
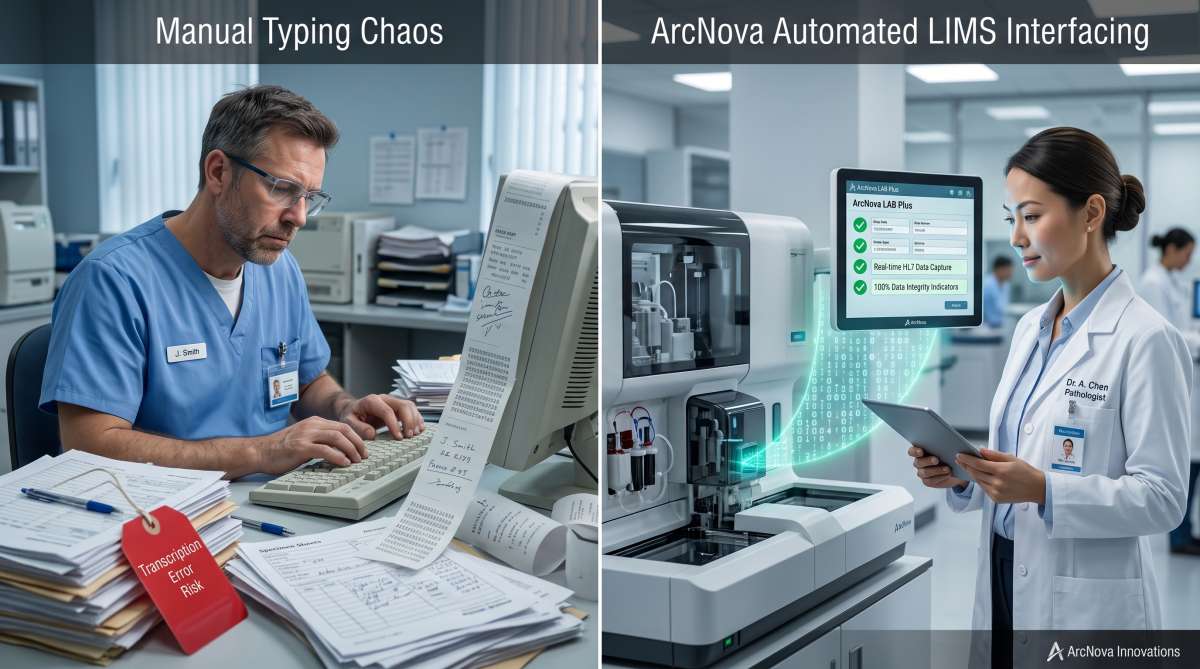
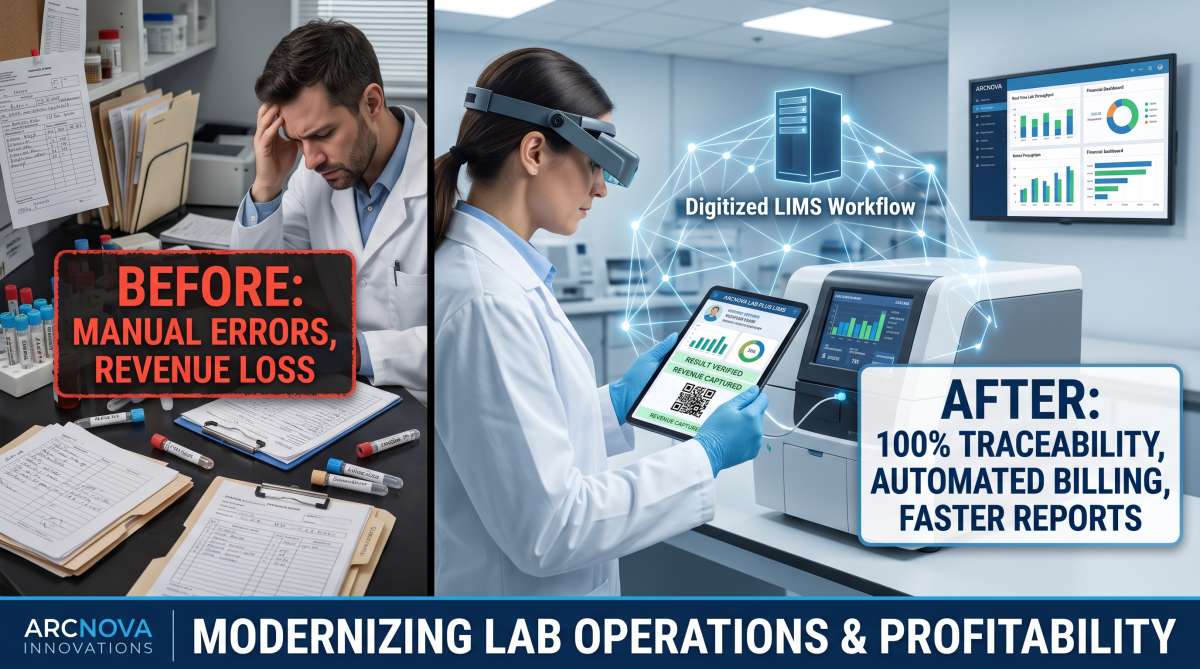
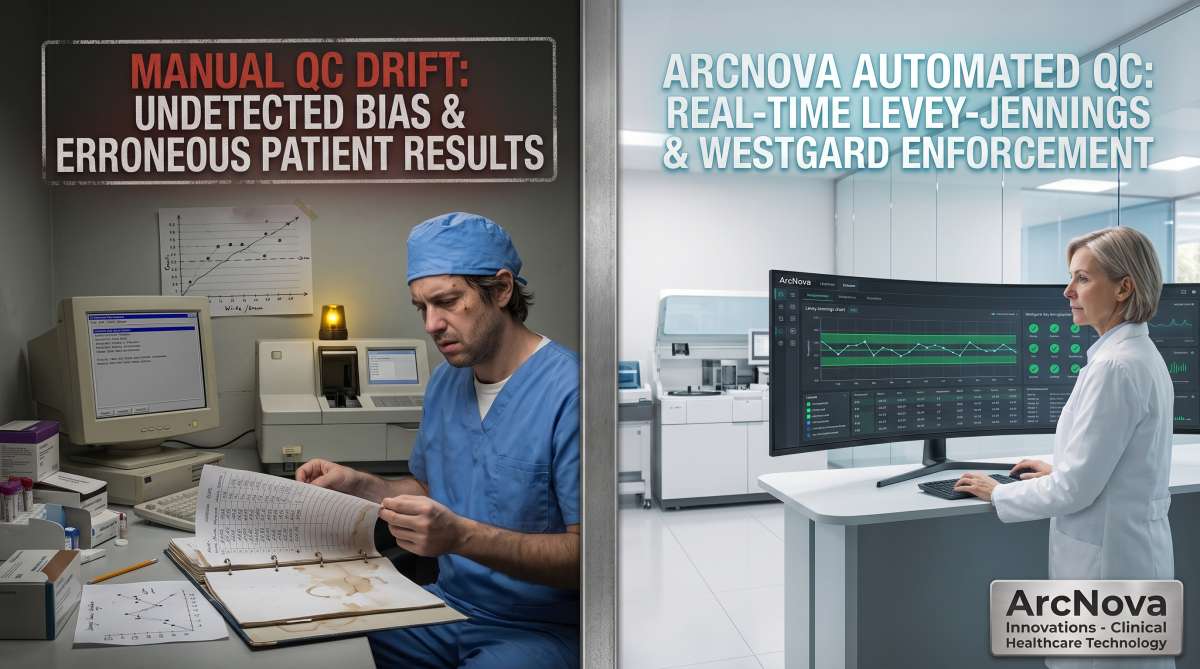
To detect these errors, laboratories run daily Quality Control (QC) materials with known target concentrations. Yet in many testing facilities, QC tracking remains completely manual: technicians write daily control values into paper binders or manually type them into disconnected Excel spreadsheets. Under high operational workloads, busy technicians rarely have time to calculate standard deviations or plot statistical curves by hand, allowing subtle calibration drift and systemic bias to go unnoticed until an external proficiency testing failure occurs—or worse, inaccurate patient results are dispatched.
Achieving international laboratory accreditation (such as ISO 15189) and ensuring clinical accuracy requires Automated Statistical Quality Control built directly into your Laboratory Information Management System (LIMS).
Automate Your Clinical Laboratory’s Quality Control & Compliance
ArcNova’s LAB Plus Management System features automated Levey-Jennings control charts, real-time Westgard multi-rule evaluation, and automatic analyzer batch-locking upon violation.
Schedule an Interactive LIMS Demonstration →Understanding Levey-Jennings Charts and Westgard Rules
Statistical process control in clinical pathology relies on two fundamental methodologies to determine whether an analytical run is in control:
- Levey-Jennings (L-J) Charts: A graphical representation of daily control measurements plotted over time against the established mean ($\mu$) and standard deviation limits ($\pm 1\text{s}$, $\pm 2\text{s}$, and $\pm 3\text{s}$). Values clustering tightly around the mean indicate analytical precision, while values straying toward the outer limits highlight potential instability.
- Westgard Multi-Rules: A series of statistical decision rules designed to differentiate between random analytical noise and systematic instrumentation drift without triggering unnecessary false alarms.
The Core Westgard Rules Evaluated by Modern LIMS
- $1_{2\text{s}}$ (Warning Rule): A single control measurement falls outside the $\pm 2\text{s}$ limit. This serves as an alert to examine the run, but does not warrant rejecting patient samples on its own.
- $1_{3\text{s}}$ (Random Error Rejection): A single control value exceeds the $\pm 3\text{s}$ threshold. This indicates a significant random error or catastrophic instrument shift; patient sample testing must stop immediately.
- $2_{2\text{s}}$ (Systematic Error Rejection): Two consecutive control measurements exceed the same $+2\text{s}$ or $-2\text{s}$ limit. This indicates systemic calibration bias across the analytical run.
- $R_{4\text{s}}$ (Range Error Rejection): The difference between two control values in the same run exceeds $4\text{s}$ (e.g., Level 1 control is at $+2.2\text{s}$ and Level 2 control is at $-2.1\text{s}$), indicating acute random error.
- $4_{1\text{s}}$ and $10_{\bar{x}}$ (Systematic Trend Rules): Four consecutive values exceeding $1\text{s}$ in the same direction, or ten consecutive values falling on one side of the mean. These identify subtle ongoing reagent degradation or photometer lamp aging before limits are crossed.
The Architecture of Automated QC Inside ArcNova LAB Plus
An enterprise LIMS removes manual human calculation from quality control by integrating directly with testing hardware:
- Automated Data Ingestion: The moment a control tube is processed by an interfaced chemistry or hematology analyzer, the raw data packet is ingested by the LIMS listener service without technician intervention.
- Instantaneous Westgard Evaluation: The system automatically evaluates the control value against active mean and SD parameters for that specific reagent lot, plotting the data point on a dynamic Levey-Jennings chart instantly.
- Automated Testing Lockout (Out-of-Control Action): If a critical rejection rule (such as $1_{3\text{s}}$ or $2_{2\text{s}}$) is violated, the software automatically locks the diagnostic test profile. The system prevents technician sign-off and blocks report generation for patient samples until a supervisor logs corrective actions and recalibrates the machine.
- Audit-Ready Documentation: Every QC event, recalibration log, reagent lot change, and supervisor sign-off is permanently recorded with timestamps, fulfilling regulatory compliance requirements for ISO 15189 inspections.
Manual QC Tracking vs. ArcNova Automated LIMS QC
| Operational Metric | Manual Paper & Excel Logging | ArcNova Automated LIMS Module |
|---|---|---|
| Data Capture | Manual transcription from thermal analyzer printouts | Direct digital parsing via automated machine interface |
| Rule Violation Detection | Delayed until month-end review or missed entirely | Sub-second automated evaluation of all Westgard rules |
| Error Containment | Patient reports often dispatched before error is noticed | Automated report dispatch lock upon rule violation |
| Accreditation Compliance | Prone to missing logs, torn sheets, and audit fines | Tamper-proof, immutable digital audit trails |
Safeguarding Diagnostic Integrity and Clinical Reputation
In pathology, diagnostic accuracy is the foundation of patient trust. Allowing unmonitored calibration drift to alter patient test numbers compromises patient safety, damages referring clinician relationships, and exposes laboratories to serious regulatory action.
By automating Levey-Jennings charting and Westgard rule enforcement inside your LIMS, laboratory leadership transforms quality control from a burdensome administrative chore into an active, automated shield—guaranteeing that every dispatched report is clinically sound.
Upgrade Your Laboratory's Quality Control Standards
Speak directly with our clinical software specialists to see a live demonstration of automated Levey-Jennings plotting and Westgard enforcement in ArcNova's LAB Plus system.
Consult with Our Health-Tech Engineers on WhatsApp